Artificial intelligence is everywhere—and every company seems eager to brand itself as an "AI company." The power utility supplying electricity is now a fundamental part of the AI ecosystem. Real estate firms are building and leasing data centers to host essential AI infrastructure. Hardware innovators are designing advanced chips and large language models that have captivated global attention. Meanwhile, traditional software companies are adopting AI to transform offerings, attract customers, and boost revenue.
But are all these "AI companies" created equal? Do they face the same challenges, growth prospects, and returns on investment? And when market turbulence strikes—such as the SaaSpocalypse earlier this year—do they all feel the impact in the same way?
These are nuanced questions. Over the past few years, investments in AI-focused companies have delivered strong returns, but the next key challenge is identifying where the greatest opportunities truly lie.
At Noonum, we've long analyzed AI-related characteristics through our Linguistic Beta at the company level and our Linguistic Strength Indicator (LSI) at the aggregate level. Now, we're formalizing these AI categories to enable structured analysis of growth, risk, and opportunity across clearly defined cohorts.
The Five-Layer Framework
In a timely manner, NVIDIA CEO and Founder, Jensen Huang, described a "five-layer AI cake" earlier this year. Building on that concept, we developed our Five-Layer Framework for classifying AI companies. This taxonomy organizes the AI ecosystem into five distinct layers:
- AI Power and Energy
- AI Chips and Compute
- AI Cloud and Infrastructure
- AI Models and Data
- AI Applications and Services
This framework allows us to:
- Measure historical growth
- Assess and quantify risk
- Identify areas of future potential
- Estimate return on investment
Signal vs. Performance
For this analysis, we examined the baseline change in LSI over the past year for each of these five AI themes, comparing it with the one-year performance of the portfolio generated from our dashboard. The size of the bubble is the total market cap in trillions of the companies exposed to that theme.
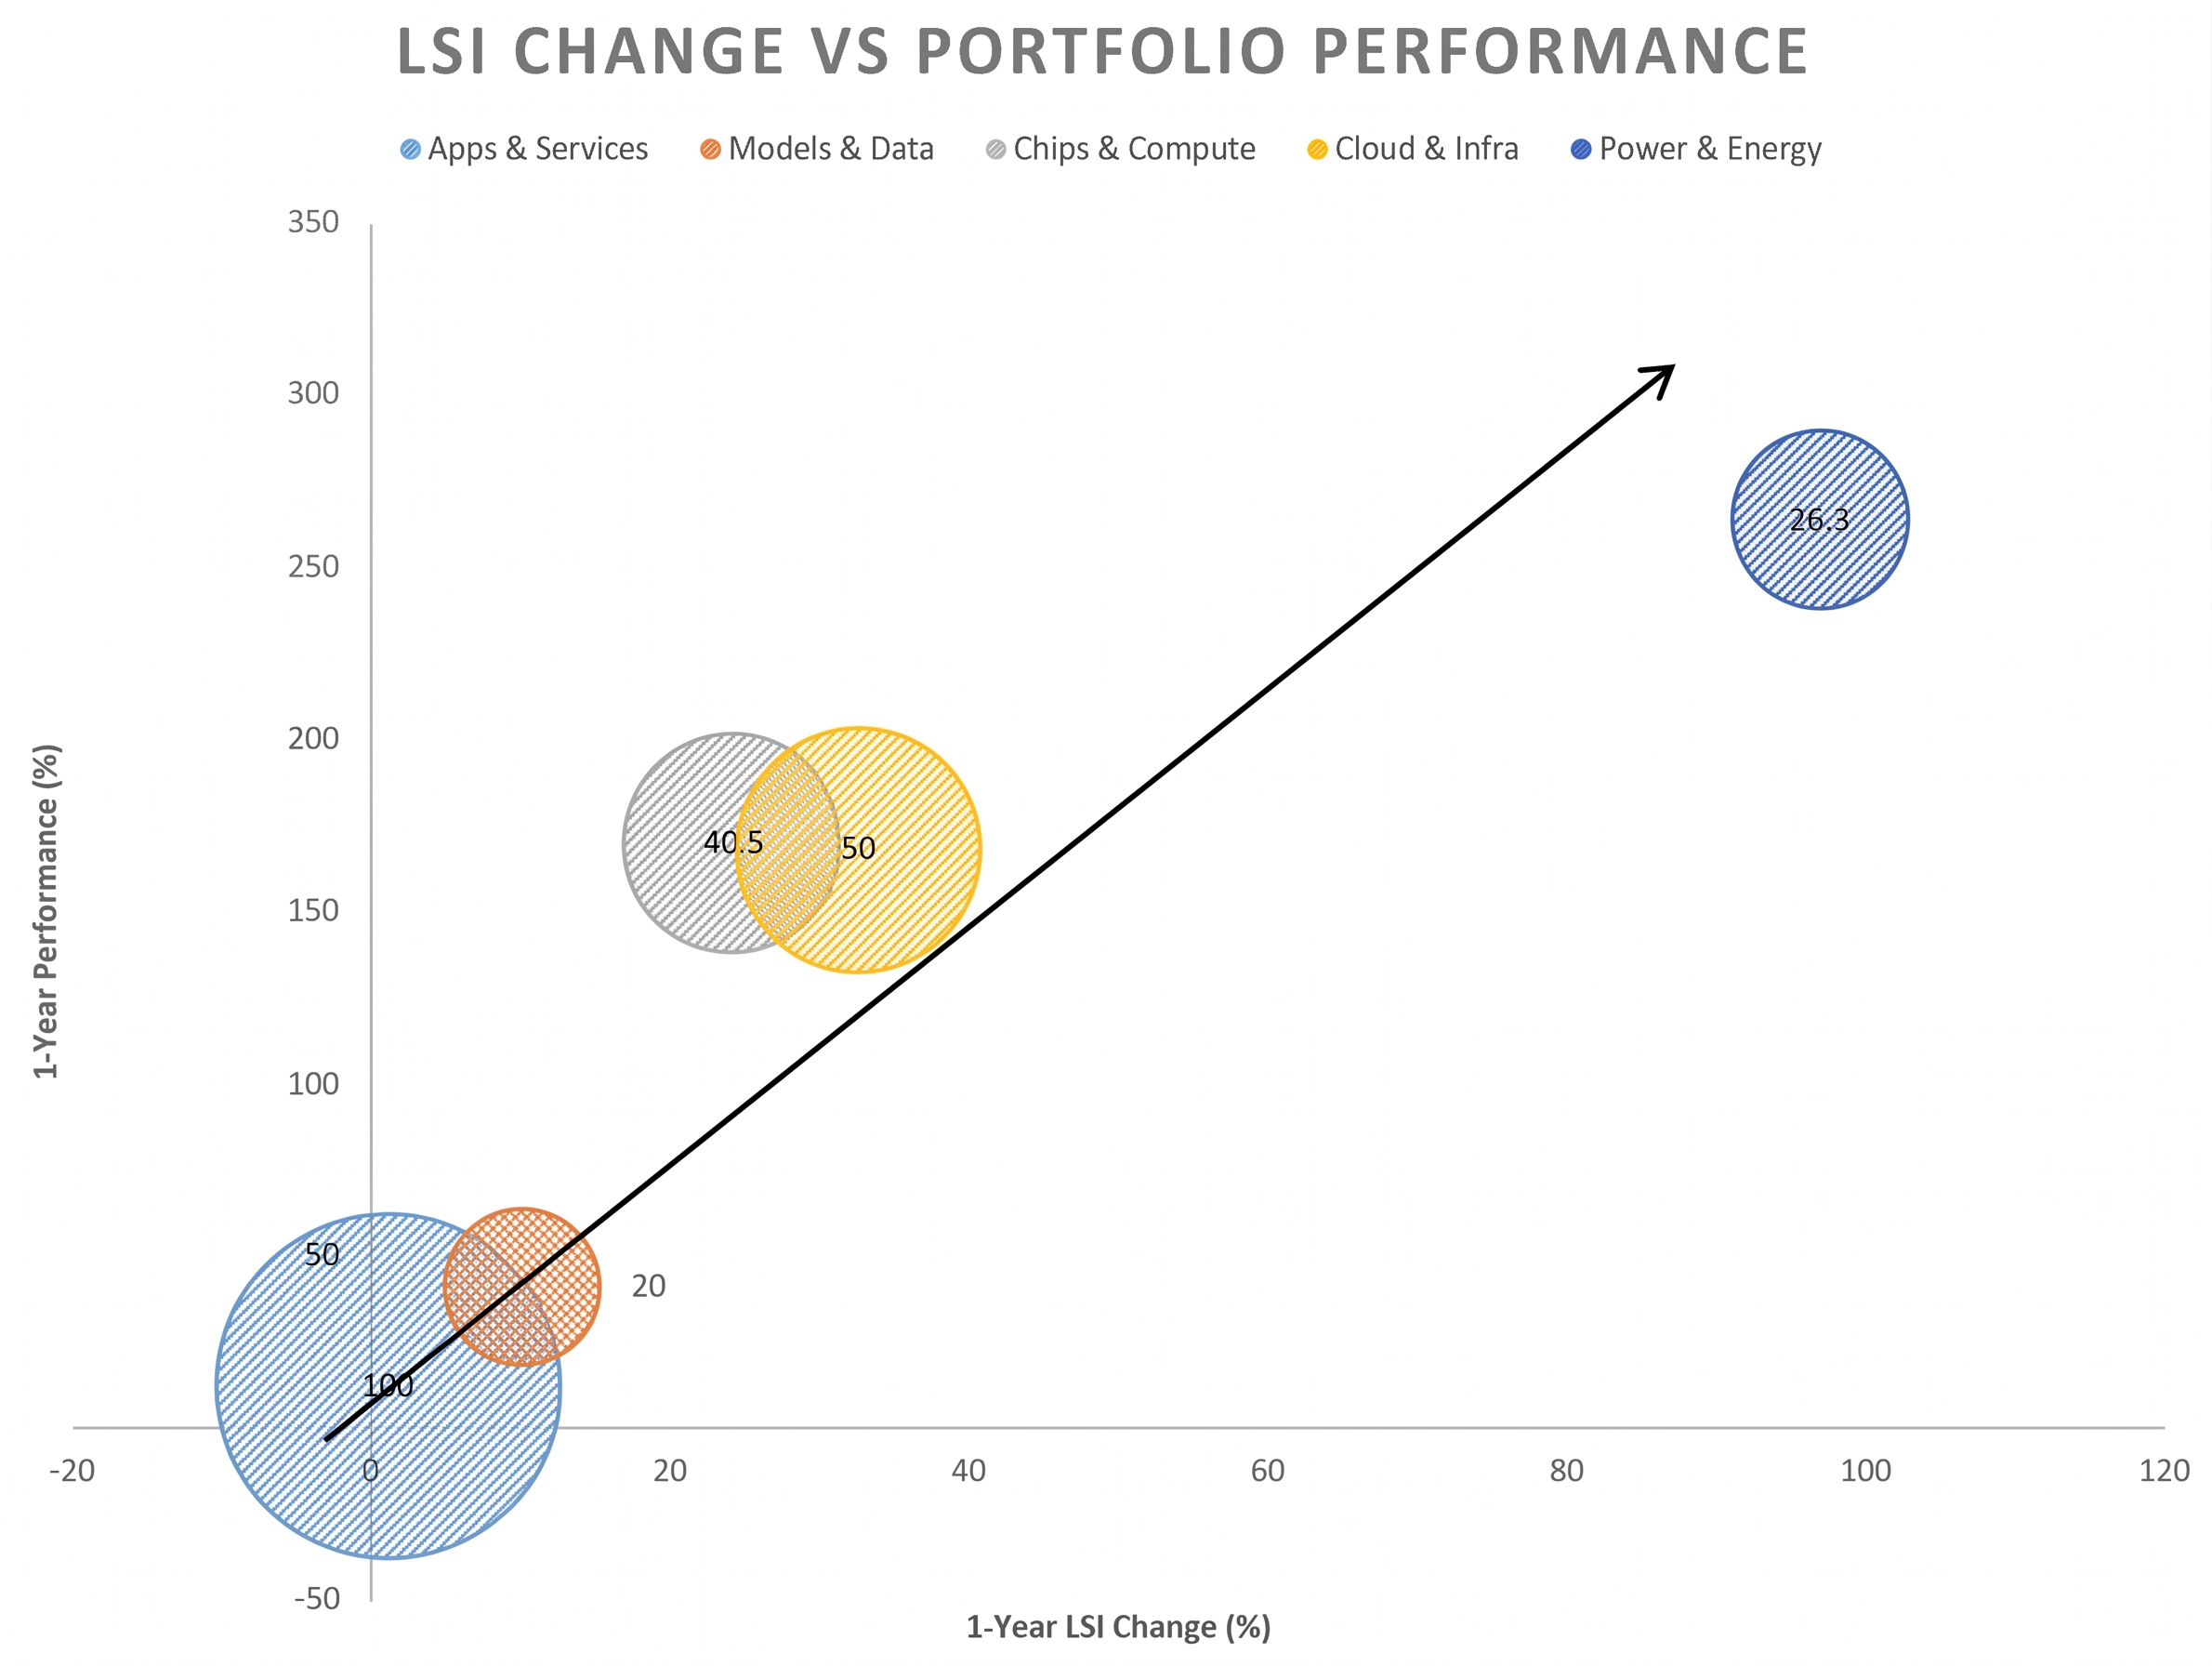
The Noonum portfolio was constructed with approximately the top 50 companies by Noonum conviction score with market capitalizations above one billion dollars, applying a 1x tilt based on the conviction score.
The AI Power & Energy theme saw a remarkable surge in its LSI, corresponding with strong performance over the past year. Conversely, AI Applications & Services exhibited subdued LSI growth, leading to index underperformance relative to S&P 500. The results were so compelling that we did a rigorous analysis that is described in the Appendix.
Summary
Grouping all AI-related companies into a single category obscures the unique risk-return dynamics of this pivotal domain. Noonum's five-layer approach highlights the distinct strengths and challenges within each AI segment.
Wall Street has long recognized that language and sentiment influence prices. Noonum now provides a systematic way to measure how linguistic patterns reveal company-level exposures to key themes. A mathematical analysis is presented in the Appendix to further substantiate this article. We encourage those that would like to explore these insights further to connect with us at Noonum.
Appendix: Where the AI Signal Rotated and Where the Returns Followed
AI isn't one trade. Over the last 12 months (April 2025 – March 2026), Noonum's thematic signal rotated sharply across five AI sub-themes — and a monthly-rebalanced, top-50 backtest shows returns tracked that rotation, producing a 89.8 percentage-point spread between the best and worst theme.
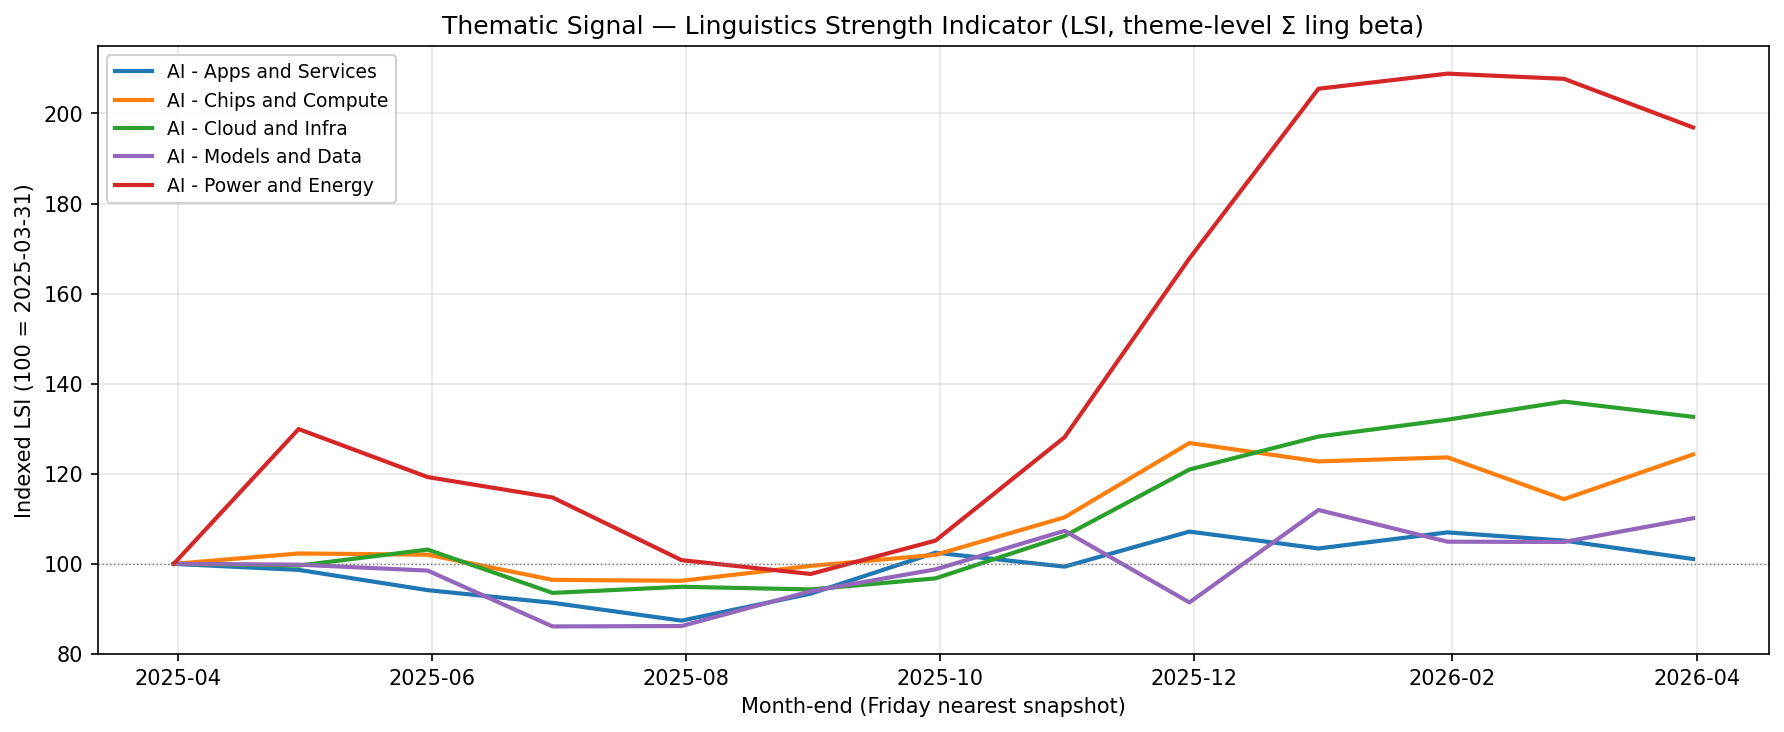
Thematic Signal — LSI across 5 AI sub-themes
Three numbers
Signal leader — AI - Power and Energy: LSI +96.9% over 12 months → portfolio return +90.3% (Sharpe 2.65, Max DD -14.4%).
Rank alignment (conviction variant): Spearman rank correlation between 12M LSI growth and 12M return across 5 themes: +0.90 (Pearson +0.85).
Dispersion: best theme +90.3%, worst theme +0.5% — a 89.8pp spread inside a single "AI" label.
Theme Breakdown (ranked by 12M return, conviction variant)
| Theme | LSI | Return | Sharpe | Max DD | Top Conviction Holdings |
|---|---|---|---|---|---|
| Power and Energy | +96.9% | +90.3% | 2.65 | -14.4% | Vertiv Holdings, NVIDIA, IREN |
| Chips and Compute | +24.3% | +68.3% | 2.65 | -8.3% | TSMC, Micron, NVIDIA |
| Cloud and Infra | +32.6% | +57.3% | 1.70 | -17.9% | NVIDIA, Nebius Group, Amazon |
| Models and Data | +10.1% | +22.1% | 0.98 | -19.4% | Alphabet, Meta Platforms, Snowflake |
| Apps and Services | +1.1% | +0.5% | 0.02 | -27.5% | Microsoft, NVIDIA, Salesforce |
Signal Decomposition — Ling Beta vs. Buzz vs. Conviction
Noonum's conviction score is the size-neutralized geometric mean of two per-company signals:
- Linguistic Beta (ling beta) — thematic alignment of a single company. The theme-level LSI (Linguistics Strength Indicator) in the signal chart above is the sum of ling beta across that theme's holdings.
- Market Buzz — attention intensity for a single company, derived from news / document frequency.
Each NAV chart below shows how a top-50 monthly-rebalanced portfolio would have evolved under one weighting variant. The three charts share the same y-axis so magnitudes are directly comparable.
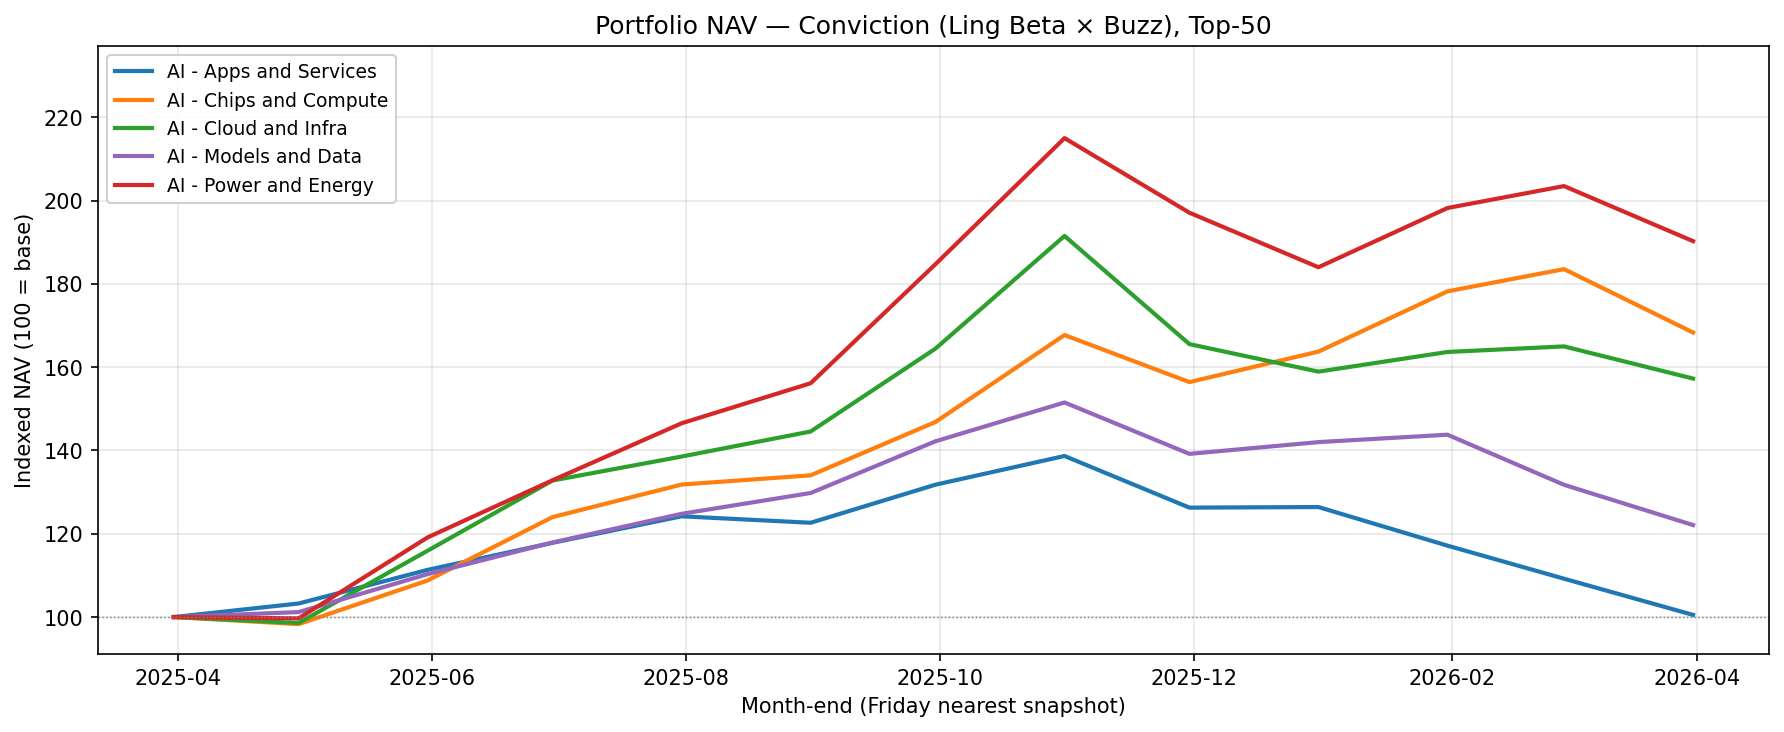
Portfolio NAV — Conviction (Ling Beta × Buzz)
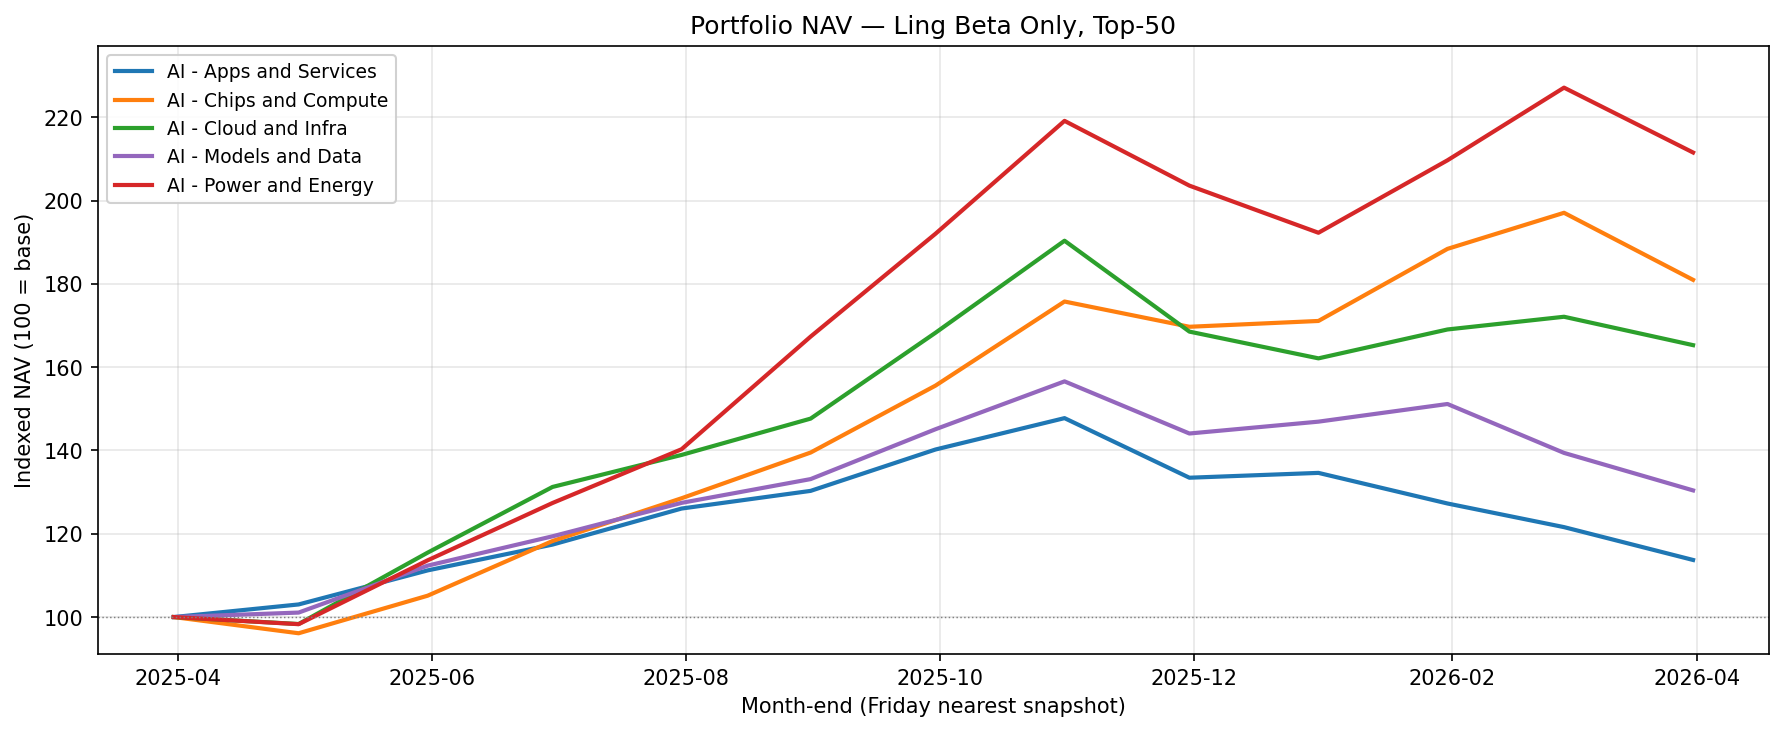
Portfolio NAV — Ling Beta only
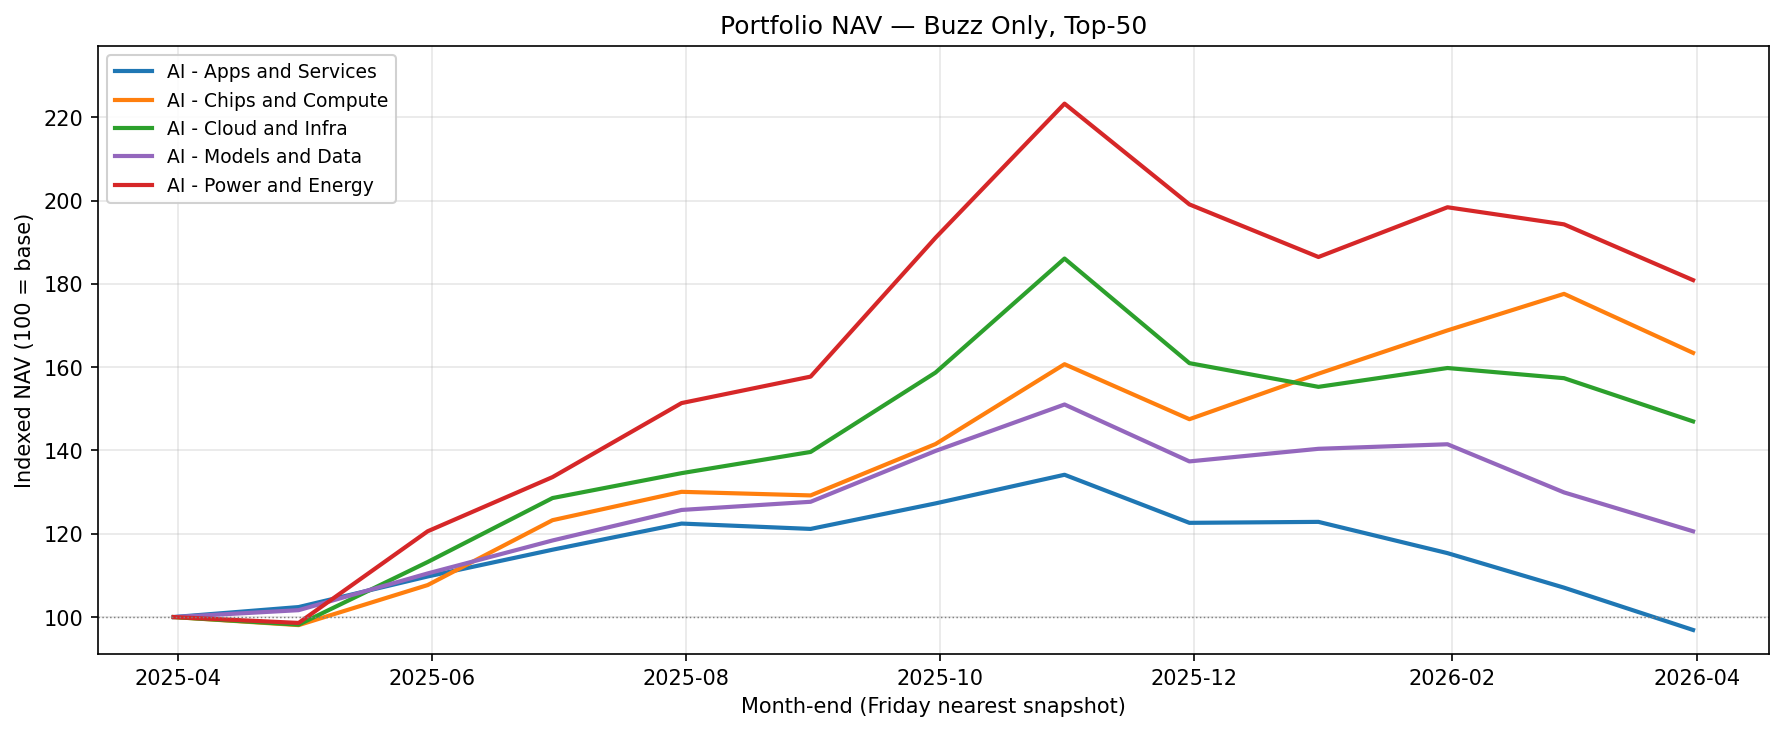
Portfolio NAV — Market Buzz only
Compressing each curve to 12-month total return:
| Theme | Conviction (Ling Beta × Buzz) | Ling Beta only | Buzz only |
|---|---|---|---|
| Power and Energy | +90.3% | +111.6% | +80.9% |
| Chips and Compute | +68.3% | +81.0% | +63.4% |
| Cloud and Infra | +57.3% | +65.3% | +47.0% |
| Models and Data | +22.1% | +30.4% | +20.6% |
| Apps and Services | +0.5% | +13.7% | -3.1% |
| Equal-weight avg | +47.7% | +60.4% | +41.8% |
12M LSI-growth ↔ 12M return alignment by variant (5 themes):
| Variant | Spearman (rank) | Pearson (magnitude) |
|---|---|---|
| Conviction | +0.90 | +0.85 |
| Ling Beta only | +0.90 | +0.89 |
| Buzz only | +0.90 | +0.83 |
All three variants produce the same theme ranking by return (Spearman +0.90) but differ in magnitude-alignment: Conviction is the most linear predictor, while weighting by ling beta alone extracts the strongest absolute alpha.
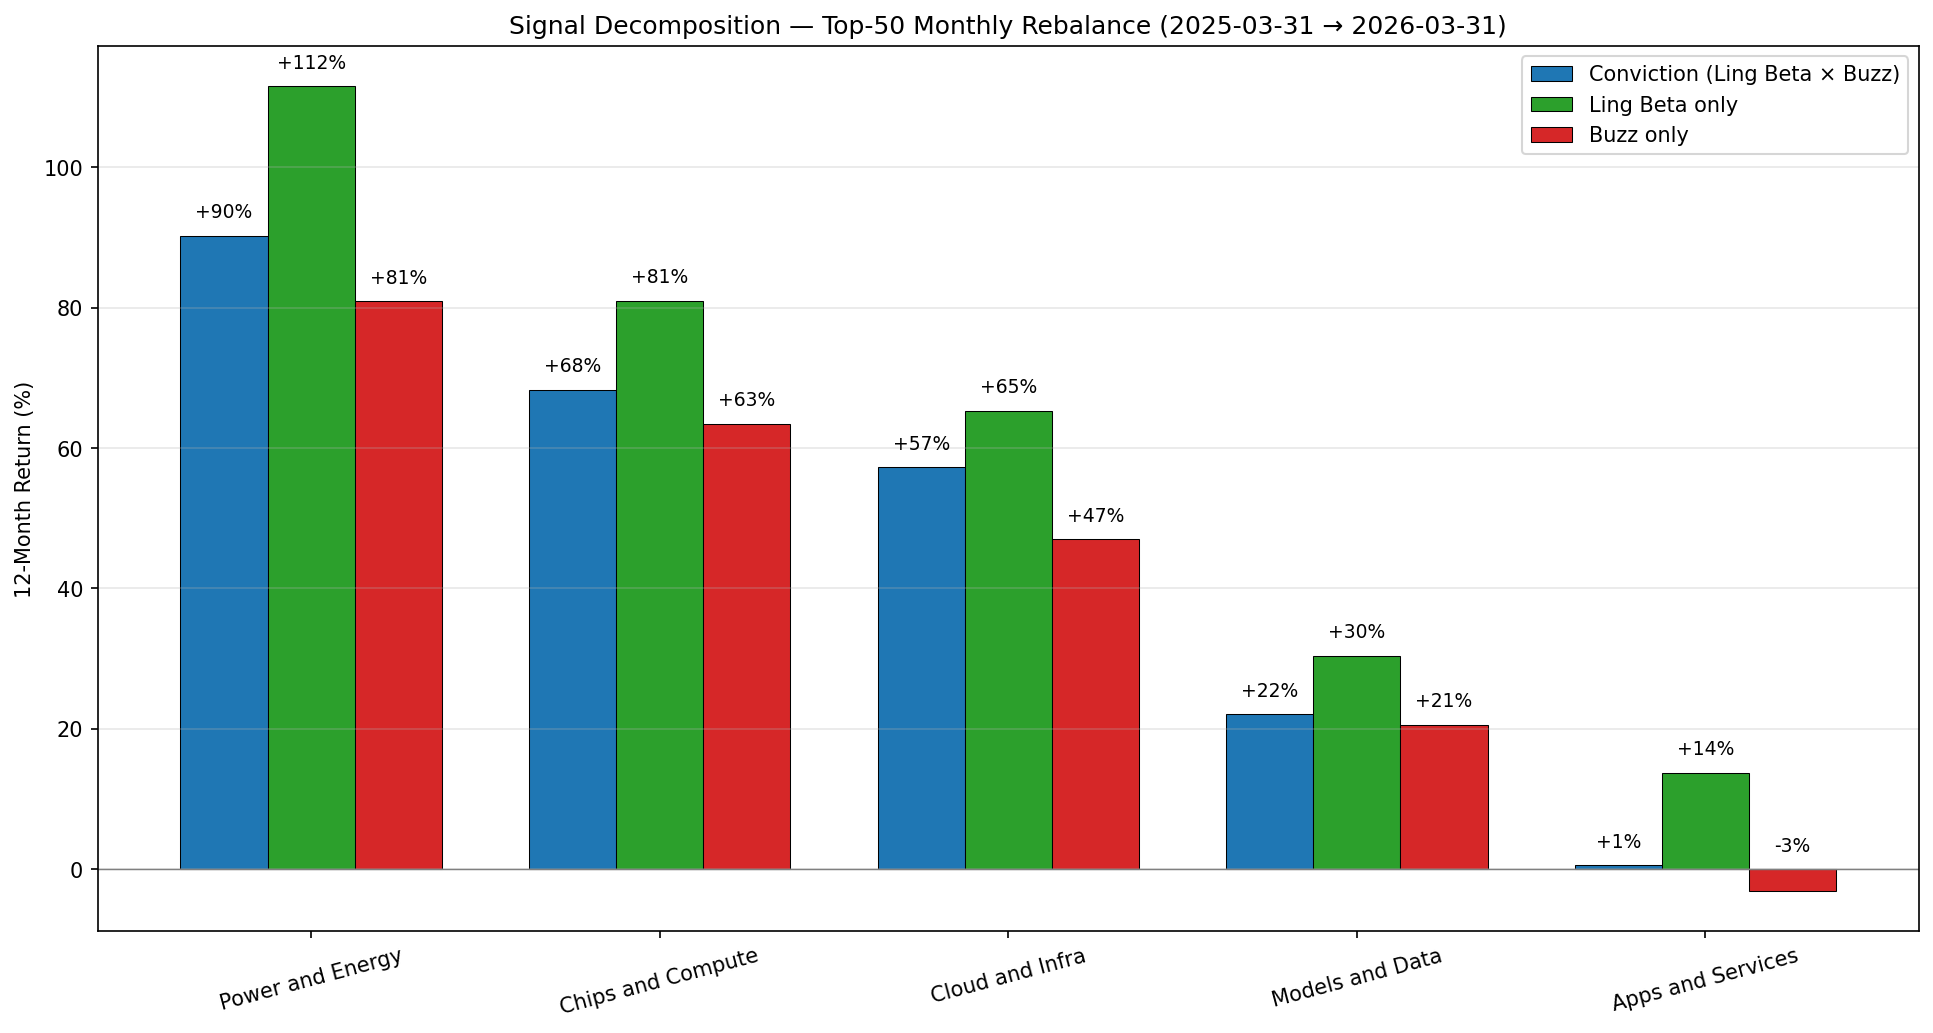
Signal Decomposition — 12M Return by Variant
Signal vs. Return — Zoomed Out
Plotting each theme's 12-month ling beta growth against its ling-beta-weighted 12-month portfolio return confirms a near-monotonic relationship: themes whose linguistic alignment accelerated most also delivered the highest realized returns.
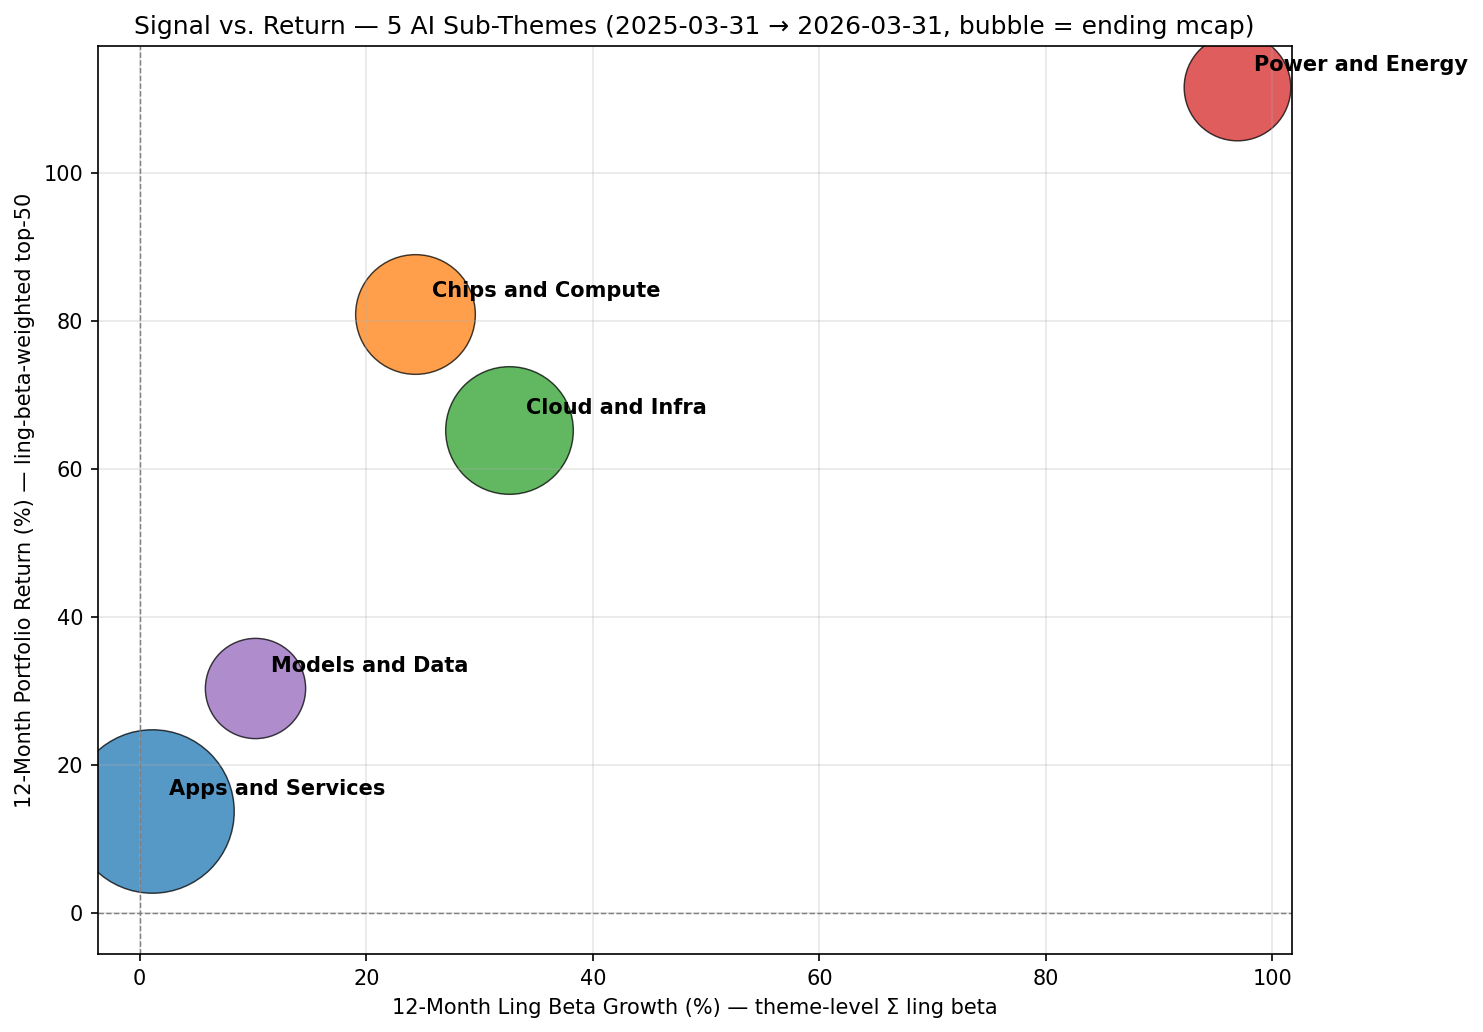
12-Month Ling Beta Growth vs. Return
Investor Takeaway
"AI" is not one allocation decision. At the sub-theme level Noonum's signal and realized returns moved together — themes with accelerating thematic signal delivered materially higher returns, while broad-coverage themes with flat signal (AI Apps & Services) lagged despite the largest universe.
The signal decomposition tells a sharper story: linguistic beta (per-company thematic alignment) is the dominant alpha driver — weighting by ling beta alone beats the combined conviction score in every single theme, averaging +60.4% vs. +47.7% for conviction and +41.8% for buzz alone. Conviction remains the most orderly predictor (Pearson +0.85), but the raw per-company thematic alignment signal extracts more magnitude of alpha.
Methodology
Universe: Five Noonum premade AI sub-strategies, 13 month-end snapshots (2025-03-31 → 2026-03-31).
Backtest: monthly rebalance; each month selects the top-50 of that month's holdings snapshot.
Three weighting variants, all size-neutralized (log-OLS residualized on market cap, then robust-normalized to (0, 1)):
Conviction — geometric mean of per-company ling beta and market buzz.
Ling Beta only — rank/weight by size-neutralized linguisticBeta.
Buzz only — rank/weight by size-neutralized marketBuzz.
LSI vs. ling beta: "LSI" (Linguistics Strength Indicator) in the signal panel refers to the theme-level sum of ling beta across that theme's holdings. "Ling beta" is the per-company score. Conviction weighting uses the per-company signal, not the theme aggregate.
Prices: weekly Friday closes, sourced from Noonum's internal stock price store.
NAV baseline: 10,000 at Friday nearest 2025-03-31.
Pooled monthly validation (conviction variant, n=60): -0.20. Monthly LSI changes are dominated by universe additions / delistings and are expected to be noisier than the 12M cross-sectional rank alignment.
Note: March 2026 universe expansion reflects an annual taxonomy refresh (larger holdings counts across all themes); rotation narrative is unaffected because each month rebalances to that month's snapshot.