The top-performing "AI" fund of the past year returned 153%. It is not an AI fund. Not even close. It does not have "AI" in its name. Most financial websites would never put it in the same category as the funds you are about to read about.
Meanwhile, the funds actually marketed as AI plays underperformed it by a wide margin. The highest-returning pure AI fund returned 75%. The lowest returned 13%.
This is not a story about stock picking. It is a story about how the AI ETF label has become almost meaningless as a predictor of actual AI exposure, and how the funds benefiting most from the AI buildout are hiding in plain sight.
At Noonum, we built a semantic knowledge-engine that assimilates what companies actually say in their filings, earnings calls, and press releases, and measures how aligned each company really is with a given investment objective. We used it to X-ray eight AI and technology ETFs across five distinct AI sub-themes. Here is what we found.
Jensen Huang's AI cake. NVIDIA's CEO describes AI as a five-layer cake, each layer distinct, each performing a different function, each rewarding investors differently.[1] The layers span from foundational compute hardware through data infrastructure, software models, cloud platforms, and end-user applications. The key implication: exposure to "AI" is not uniform. Each layer carries a different economic driver, growth trajectory, and, as the period under review illustrates, a materially different return profile.
We created an index for each of those 5-layers with Noonum, and here is what each layer returned over the past year:
| AI Layer | What It Is | 1-Year Return |
|---|---|---|
| Power & Energy | Power plants, cooling systems, grid hardware for AI data centers | +264% |
| Chips & Compute | Semiconductors and hardware that run AI | +170% |
| Cloud & Infra | Data centers and networks AI runs on | +168% |
| Models & Data | AI models and the data they are trained on | +41% |
| Apps & Services | Software products and applications built on top of AI | +13% |
Noonum AI sub-theme strategy index returns, May 2025 to May 2026. Not investable products. Source: Noonum.[5]
The gap is enormous. Power & Energy returned 264%. Apps & Services returned 13%. Same broad AI theme. Very different story depending on which slice of the cake you owned.
How Noonum Scores Each ETF
For each ETF, Noonum assigns every holding a Linguistic Beta score, which measures how strongly that company's public language aligns with each of the five AI sub-themes above. That score is then multiplied by the holding's weight in the fund. Sum across all holdings and you get the fund's overall sub-theme profile. No sector labels. No guesswork. Just what the companies actually say in their own words.[2]
Eight ETFs were selected based on AUM, covering four pure AI funds and four broad technology funds included for comparative context. BOTZ was excluded from alignment analysis due to incomplete Noonum scoring data. DRAM (Roundhill Memory ETF) was excluded as it launched April 2, 2026, with insufficient price history for a full-period comparison.[3]
Here is how all eight funds look through the Noonum lens:
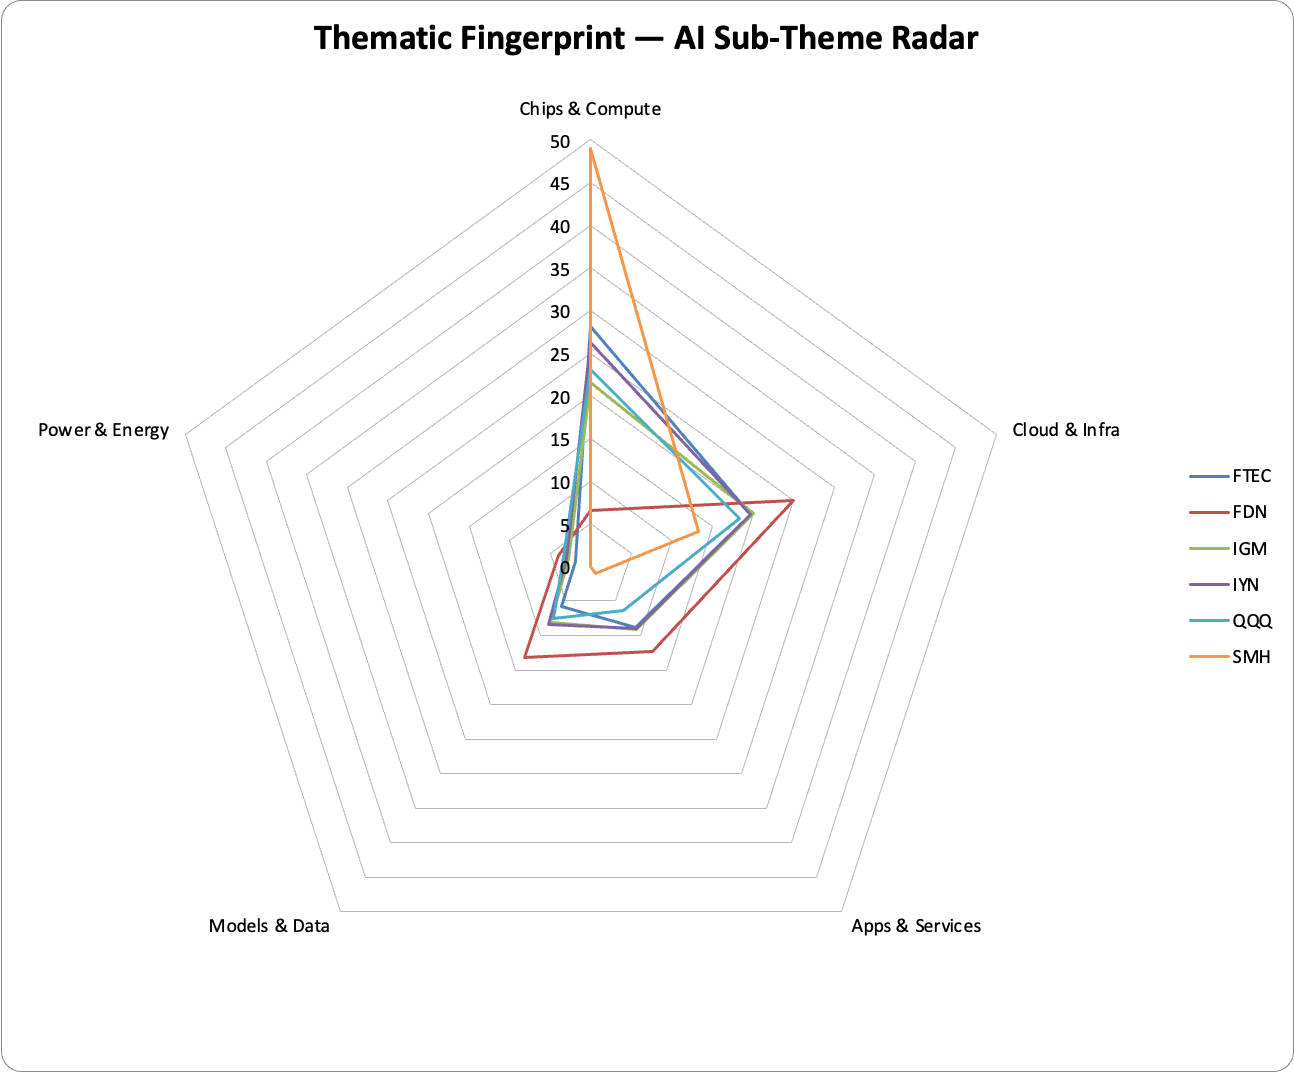
Every fund clusters together except one. SMH's 48.9% Chips and Compute alignment is nearly double the next highest fund. It returned 153.6%, more than twice the next best fund in the study.
| ETF | Full Name | Category | AUM | Chips | Cloud | Apps | Models | Power | 1-Yr Return |
|---|---|---|---|---|---|---|---|---|---|
| SMH | VanEck Semiconductor | Broad Tech | $59B | 48.9% | 13.3% | 1.0% | 0.0% | 0.0% | +153.6% |
| QTUM | Defiance Quantum | Pure AI | $4.0B | 21.4% | 11.5% | 5.7% | 4.3% | 2.0% | +74.8% |
| IGM | iShares Expanded Tech | Broad Tech | $6B | 21.6% | 20.1% | 9.2% | 8.1% | 2.7% | +60.8% |
| FTEC | Fidelity MSCI IT | Broad Tech | $15B+ | 28.1% | 19.7% | 8.9% | 5.8% | 1.9% | +58.0% |
| AIQ | Global X AI & Tech | Pure AI | $7.9B | 17.2% | 14.8% | 12.5% | 7.3% | 2.4% | +51.5% |
| QQQ | Invesco Nasdaq-100 | Broad Tech | $300B+ | 23.1% | 18.3% | 6.4% | 7.5% | 3.3% | +45.8% |
| BOTZ* | Global X Robotics & AI | Pure AI | $3.6B | — | — | — | — | — | +33.9% |
| XT | iShares Exp. Tech | Pure AI | $3.7B | 14.6% | 8.6% | 3.4% | 3.8% | 2.6% | +30.7% |
| FDN | First Trust Internet | Pure AI | $4.0B | 6.4% | 25.6% | 12.0% | 12.9% | 4.0% | +12.8% |
*BOTZ excluded from alignment analysis. DRAM excluded: launched April 2, 2026. Source: Noonum, Yahoo Finance.[3][4]
The Numbers That Tell the Real Story
Before the individual findings, two statistics frame everything that follows.
r = 0.29 | R² = 0.08
Total AI alignment vs 1-year return. Negligible explanatory power.
Knowing how much total AI alignment a fund has explains just 8% of the variance in its one-year return. That is essentially zero predictive signal. The funds with the highest aggregate AI scores did not outperform. The funds with lower scores did not underperform. The label is noise.
r = 0.95 | R² = 0.90
Chips and Compute alignment vs 1-year return. The strongest predictor in the study.
Sub-theme composition is not noise. Chips and Compute alignment alone explains 90% of return variance across the eight funds. The conclusion is direct: it is not how much AI a fund owns. It is which part of AI it owns.
| Sub-Theme | r | R² | What it means |
|---|---|---|---|
| Chips and Compute | 0.95 | 0.90 | Higher chip alignment correlated strongly with higher returns |
| Cloud and Infra | -0.36 | 0.13 | Minimal relationship with returns across the sample |
| Apps and Services | -0.64 | 0.41 | Higher apps exposure associated with lower returns |
| Models and Data | -0.79 | 0.63 | Higher models alignment correlated with lower returns |
| Power and Energy | -0.93 | 0.86 | Near-zero variance in alignment across all funds; not a negative signal |
Pearson correlations across eight funds. Directional only given sample size. Power and Energy note: all funds score between 0.02% and 3.96% on this sub-theme, making the correlation statistically meaningless rather than informative. Source: Noonum, Yahoo Finance.
The Findings
Finding 1: The label means almost nothing
The three highest-returning funds in the study carry no AI mandate whatsoever. SMH returned 153.6%. IGM returned 60.8%. FTEC returned 58.0%. Every single one of them outperformed every pure AI fund except QTUM.
The Noonum X-ray explains exactly why. Pure AI ETFs are disproportionately concentrated in Apps and Services and Cloud and Infra, the two lowest-performing sub-themes over the period. Broad technology funds, despite carrying no AI mandate, have significantly higher Chips and Compute alignment, which turned out to be the only sub-theme that strongly predicted returns.
Most AI ETFs were built around a software and services thesis that made intuitive sense in 2021. But the AI buildout of 2025 rewarded a different layer of the stack entirely. The funds with the right exposure were not the ones with "AI" in their name. They were the ones that happened to own the right companies.
FDN has the highest total AI alignment score of any fund in this study at 60.9%. It also delivered the lowest return at 12.8%. QTUM has less total AI alignment than FDN and returned 74.8%. Total alignment is not just a weak signal. In this sample, it pointed in the wrong direction.
Finding 2: The fund that delivered the highest return was not an AI fund
SMH, the VanEck Semiconductor ETF, returned 153.6% over the twelve months. It does not appear in AI ETF screeners. It does not market itself as an AI investment. Its prospectus does not mention artificial intelligence as an objective.
But through the Noonum lens, SMH has 48.9% Chips and Compute alignment, nearly double the next highest fund. NVIDIA represents approximately 17.6% of the portfolio, with TSMC, Broadcom, and AMD also among the largest positions.[7] While NVIDIA's weight is meaningful, the fund's outperformance reflects sector-level dynamics, not single-stock concentration. Broad semiconductor demand driven by AI training infrastructure was the engine.
This is the picks and shovels story playing out in real time. During a gold rush, the people selling shovels often do better than the people mining. In the AI buildout, the semiconductor companies making the chips dramatically outperformed the software companies building on top of them. Noonum's language-based scoring identified this before a single price chart was consulted. A standard AI ETF screener would never have flagged SMH at all.
Finding 3: You might already own more AI than you think
QQQ, the Invesco Nasdaq-100 ETF, has over $300 billion in assets. Most people think of it as a broad technology fund, not an AI fund. They should reconsider.
QQQ returned 45.8% with a Sharpe ratio of 2.39 and the shallowest drawdown of any fund in the study at -12.2%. On a risk-adjusted basis, it competes favorably with every pure AI fund except QTUM. Through the Noonum lens, QQQ carries 23.1% Chips and Compute alignment and 18.3% Cloud and Infra alignment, not because it was designed around an AI thesis, but because the largest Nasdaq-100 constituents by market cap happen to be the principal beneficiaries of AI infrastructure investment.
The practical implication for investors is significant. Those who hold QQQ as a core technology position and are considering adding a dedicated AI ETF should understand that incremental AI exposure may be smaller than assumed. Sub-theme overlap could result in unintentional concentration in the same underlying companies.
Finding 4: A fund appearing in AI screens that does not market itself as AI
FDN, the First Trust Dow Jones Internet ETF, delivered the lowest return in the study at +12.8%, the deepest drawdown at -21.3%, and the only Sharpe ratio below 1.0 at 0.73. By every measure that matters to an allocator, it was the least efficient fund in this group.
FDN does not market itself as an AI ETF. Its stated objective is to track the Dow Jones Internet Composite Index.[8] Yet it appears regularly in AI ETF comparison screens and financial media lists alongside dedicated AI products. This illustrates precisely what Noonum's X-ray is designed to surface: the actual thematic exposure of any fund regardless of its label, in either direction.
FDN's Noonum profile tells the story before a single return is observed. It carries the lowest Chips and Compute alignment of any fund in the study at 6.4%, and is instead concentrated in Cloud and Infra at 25.6% and Apps and Services at 12.0%, the two lower-performing sub-themes. This same logic applies to QQQ in the opposite direction: Noonum surfaces genuine AI infrastructure exposure in a fund that does not claim it, just as it surfaces thematic misalignment in a fund that appears alongside ones that do.
| Metric | FDN | Study average excluding FDN |
|---|---|---|
| 1-Year Return | +12.8% | +56.7% |
| Sharpe Ratio | 0.73 | 2.16 |
| Max Drawdown | -21.3% | -15.6% |
| Chips and Compute Alignment | 6.4% | 23.0% |
FDN ranked last on return, Sharpe ratio, and drawdown. Its Chips and Compute alignment of 6.4% against a study average of 23.0% explains the gap.
Finding 5: How you build the fund matters as much as what you put in it
Among the pure AI funds, QTUM stands apart. The Defiance Quantum ETF returned 74.8% with a Sharpe ratio of 2.33, well ahead of every other pure AI fund in the study and ahead of two of the four broad technology funds.
QTUM uses patent-based screening rather than traditional sector classification. It identifies companies with meaningful intellectual property in quantum computing and machine learning regardless of their GICS category.[9] That independent methodology led it to a higher Chips and Compute profile at 21.4% than any other pure AI fund, and lower exposure to the underperforming Apps and Services layer.
Noonum's language-based scoring and QTUM's patent-based screening arrived at similar conclusions through completely different methods. That convergence is meaningful. Both approaches, when they look beneath the surface of a fund's label, identify the same compositional advantage. The difference between QTUM's 74.8% return and FDN's 12.8% return is not luck. It is construction methodology.
The broader point: two funds can call themselves AI ETFs and have almost nothing in common underneath. Construction methodology determines sub-theme composition, and sub-theme composition determines returns.
Finding 6: The safest AI plays were the broad tech funds
Raw return is the number everyone quotes. For investors who care about risk-adjusted performance, the picture shifts even more decisively against the pure AI category.
| ETF | 1-Year Return | Annualised Volatility | Sharpe Ratio | Type |
|---|---|---|---|---|
| SMH | +153.6% | 30.4% | 3.24 | Broad Tech |
| IGM | +60.8% | 20.6% | 2.42 | Broad Tech |
| QQQ | +45.8% | 16.5% | 2.39 | Broad Tech |
| FTEC | +58.0% | 20.9% | 2.32 | Broad Tech |
| QTUM | +74.8% | 25.6% | 2.33 | Pure AI |
| AIQ | +51.5% | 22.4% | 1.98 | Pure AI |
| XT | +30.7% | 17.6% | 1.63 | Pure AI |
| BOTZ | +33.9% | 23.9% | 1.35 | Pure AI |
| FDN | +12.8% | 19.2% | 0.73 | Pure AI |
Sharpe ratio calculated as annualised return divided by annualised standard deviation of daily returns, without risk-free rate adjustment. Source: Yahoo Finance.
The three highest Sharpe ratios in the study belong to IGM (2.42), QQQ (2.39), and FTEC (2.32), all broad technology funds. The only pure AI fund with a comparable risk-adjusted profile is QTUM at 2.33. BOTZ (1.35) and FDN (0.73) delivered the least efficient returns. SMH's Sharpe of 3.24 is the highest in the group, but its annualised volatility of 30.4% is nearly double QQQ's, which may create real constraints for allocators with risk or tracking error budgets.
The specialist funds charging a premium for targeted AI exposure did not just underperform on raw returns. They underperformed on the metric that matters most to the institutional allocators they are trying to attract.
Contextual Reference: Noonum Sub-Theme Index Returns
To put the ETF returns in context, here are the one-year returns for Noonum's five live AI sub-theme strategy indices over the same period. These are rules-based indices maintained by Noonum and are not investable products. They are provided to illustrate the return dispersion across sub-themes and the opportunity set that sub-theme alignment identifies.[5]
| AI Sub-Theme | Index 1-Yr Return | Rank | Key driver |
|---|---|---|---|
| Power and Energy | +264.0% | 1 | Data centre power demand; nuclear, grid hardware, liquid cooling |
| Chips and Compute | +169.9% | 2 | Semiconductor supply for AI training and inference workloads |
| Cloud and Infra | +168.3% | 3 | Hyperscaler AI infrastructure investment; data centre networking |
| Models and Data | +41.3% | 4 | LLM development; data platforms and analytics providers |
| Apps and Services | +12.7% | 5 | Consumer and enterprise AI software; SaaS AI integration |
The five AI sub-themes returned very differently over the past year. The top three exceeded 160%. Apps and Services, where most pure AI ETFs are concentrated, returned 13%.
The return dispersion across sub-themes is stark: Power and Energy (+264.0%) outperformed Apps and Services (+12.7%) by 251 percentage points over twelve months. Most pure AI ETFs are concentrated at the bottom of this table. Most broad technology funds accidentally captured the middle. Not a single fund in this study meaningfully captured the top.
What This Means
The AI ETF category has a labeling problem.
The funds marketed as AI vehicles are concentrated in the software and services layer of the AI value chain, which delivered the weakest sub-theme returns over the period examined. The funds that were not marketed as AI products accidentally captured more of the hardware and infrastructure layers, which delivered the strongest.
Total AI alignment explains just 8% of one-year return variance in this sample. Chips and Compute alignment explains 90%. The difference between those two numbers is the difference between a label and a signal.
For individual investors, three questions are worth asking about any AI ETF you hold or are considering:
Which slice of the cake does it own? The sub-theme composition matters far more than whether a fund has "AI" in its name.
Do you already own it? If you hold QQQ or a broad tech index fund, you likely have more AI exposure than you realize. Adding a dedicated AI ETF may be concentrating risk you already carry, not adding something new.
How was it built? Standard sector labels miss a great deal. Funds using differentiated construction methodology, whether patent-based like QTUM or language-based like Noonum's indices, tend to find different companies. That difference showed up clearly in the returns.
Three limitations of this analysis are worth stating directly. The cross-sectional sample of eight funds is small, and correlation findings should be treated as directional evidence rather than statistically robust conclusions. The study covers a single twelve-month period representing a specific market regime characterized by strong AI investment sentiment and semiconductor outperformance. And because alignment scores are contemporaneous with returns rather than measured at the start of the period, the analysis establishes association rather than predictive causality. Future work using point-in-time historical scores across a larger fund universe and longer time series would substantially strengthen these findings.
The AI investing conversation is dominated by labels. What it requires is language.
References
[1] Jensen Huang, NVIDIA CEO. AI five-layer cake framework, NVIDIA GTC and investor presentations, 2024 to 2025. nvidia.com
[2] Noonum Linguistic Beta methodology. noonum.ai
[3] BOTZ: Global X Robotics and AI ETF. globalxetfs.com/funds/botz | DRAM: Roundhill Memory ETF, launched April 2, 2026.
[4] Price return data sourced from Yahoo Finance, May 2025 to May 2026. finance.yahoo.com
[5] Noonum AI sub-theme strategy index returns. Live rules-based indices maintained by Noonum. Not investable products. noonum.ai
[6] ETF providers: SMH: vaneck.com | QTUM: defianceetfs.com/qtum | IGM, XT: ishares.com | FTEC: fidelity.com | QQQ: invesco.com | AIQ, BOTZ: globalxetfs.com | FDN: ftportfolios.com
[7] SMH holdings: VanEck Semiconductor ETF. NVIDIA weight approximately 17.6% as of May 2026. vaneck.com
[8] FDN stated objective: First Trust Dow Jones Internet Index Fund. ftportfolios.com
[9] QTUM patent-based methodology: Defiance Quantum ETF. defianceetfs.com/qtum
This report is published by Noonum for informational and research purposes only. It does not constitute investment advice, a recommendation to buy or sell any security, or an offer of any kind. Past performance is not indicative of future results. The analysis covers May 2025 to May 2026 and reflects a specific market environment; findings may not apply to other periods. Noonum sub-theme index returns are derived from proprietary rules-based strategies and are not investable products. Holdings data as of May 1, 2026. Copyright 2026 Noonum. All rights reserved. noonum.ai