
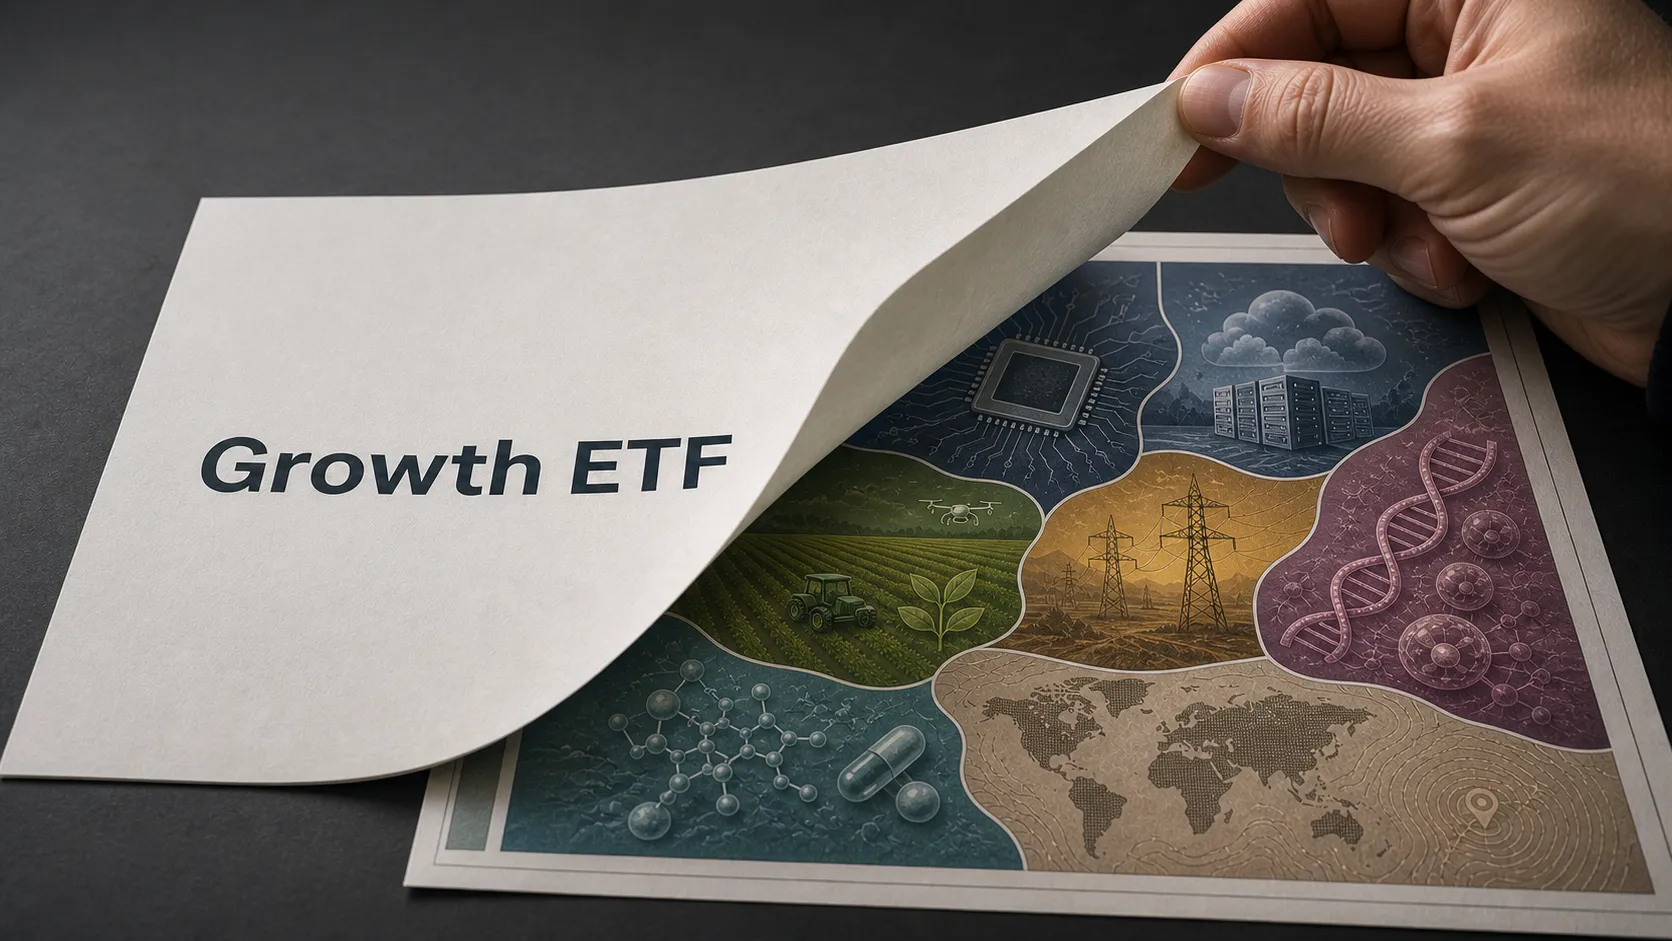
We X-Rayed 9 Growth ETFs Through the Noonum Megatrends Lens
Six of the nine largest growth ETFs are thematically identical. Two are hiding a biotech story. One is quietly one of the largest agricultural tech vehicles in the market. And not a single fund tells you any of this.
Growth ETFs are among the most widely held products in the market. VUG alone manages $233 billion. IWF manages $129 billion. Together the nine funds in this study hold over $613 billion in assets. Millions of investors hold them as core positions, as retirement vehicles, as expressions of confidence in the future of the economy.
But what does growth actually mean through a thematic lens? Which forces are these funds genuinely aligned with? Is a dollar in VUG doing the same thing as a dollar in IWP? And are investors in these funds getting the diversification they assume they are?
We used Noonum’s Megatrends lens to find out. We measured every holding in all nine ETFs against four major Megatrend categories, AI sub-themes, and dozens of sub-category breakdowns, using Linguistic Beta scores that reflect what companies actually say in their filings, earnings calls, and press releases. No sector labels. No index methodology assumptions. Just language.
What we found should change how you think about growth exposure.
How Noonum Scores Each Fund
For each ETF, Noonum assigns every holding a Linguistic Beta score measuring how strongly that company’s public language aligns with a given investment theme. That score is multiplied by the holding’s weight in the fund. Sum across all holdings and you get the fund’s actual thematic profile. The result is a Megatrends fingerprint for each fund that its prospectus, factsheet, and ticker symbol cannot give you.
Nine ETFs were selected to represent the full range of growth investing across market cap tiers:
| Ticker | Index | AUM | Tier |
|---|---|---|---|
| VUG | CRSP US Large Cap Growth | $233B | Large |
| QQQM | Nasdaq-100 | $70.7B | Large |
| IWF | Russell 1000 Growth | $129B | Large |
| IVW | S&P 500 Growth | $64B | Large |
| SCHG | Dow Jones US Large-Cap Growth | $50.5B | Large |
| MGK | CRSP US Mega Cap Growth | $24.5B | Large |
| IWY | Russell Top 200 Growth | $17.1B | Large |
| IWP | Russell Mid-Cap Growth | $14.3B | Mid |
| IWO | Russell 2000 Growth | ~$10B+ | Small |
Finding 1: Six Large-Cap Growth ETFs Are Thematically Identical
The most striking finding in this entire analysis is not an outlier. It is the absence of one.
VUG, IWF, IVW, SCHG, MGK, and IWY carry total AI alignment scores between 62.9% and 65.0%. Chips and Compute sits between 21.3% and 23.2% across all six. Cloud and Infra sits between 20.7% and 21.9%. The range across the six funds on every AI sub-theme is smaller than two percentage points.
These six funds track different indices, are managed by different issuers, have different expense ratios, and include between 59 and 197 holdings. Through the Noonum lens, they are producing functionally identical thematic exposure. Investors who own more than one of these products to diversify their growth allocation are not diversifying. They are doubling down.
QQQM is the one large-cap fund that breaks the pattern. Its Chips and Compute score of 24.41% is the highest among large-cap funds. Its Cloud and Infra score of 18.63% is the lowest. The Nasdaq-100’s concentration in semiconductor names pulls it toward the hardware layer of Jensen Huang’s five-layer AI cake and away from the cloud and services layer that dominates the rest. But even QQQM is operating within the same broad thematic universe as its peers. The divergence is in degrees, not direction.
The practical implication is direct. An investor holding VUG as a core position and IWF as a satellite position is not building a diversified growth allocation. They are running two near-identical thematic bets.
| ETF | AI Total | Chips | Cloud | Power | Apps | Models |
|---|---|---|---|---|---|---|
| VUG | 65.03% | 22.29% | 21.93% | 4.30% | 7.19% | 9.32% |
| IWF | 62.94% | 22.55% | 20.79% | 3.96% | 7.16% | 8.48% |
| IVW | 64.55% | 23.98% | 21.50% | 4.20% | 6.28% | 8.58% |
| SCHG | 62.92% | 21.27% | 20.72% | 4.47% | 7.82% | 8.64% |
| MGK | 64.93% | 22.19% | 21.86% | 4.05% | 7.61% | 9.22% |
| IWY | 63.74% | 23.19% | 20.88% | 3.56% | 7.47% | 8.64% |
| QQQM | 59.52% | 24.41% | 18.63% | 3.26% | 6.09% | 7.14% |
| IWP | 38.25% | 3.65% | 6.99% | 19.68% | 5.78% | 2.15% |
| IWO | 26.52% | 7.67% | 8.50% | 3.69% | 5.04% | 1.63% |
Noonum Linguistic Beta alignment scores. Holdings as of June 2026. Source: Noonum.
Finding 2: AI Alignment Falls Sharply as Market Cap Shrinks
The single most powerful predictor of AI alignment (based on Noonum’s 5-Layer AI) in this study is market cap tier. Not index methodology. Not the issuer. Not the expense ratio. Size.
Large-cap growth funds average 64.0% total AI alignment. IWP, the mid-cap growth fund, scores 38.25%. IWO, the small-cap growth fund, scores 26.52%. The decline from large-cap average to small-cap is nearly 38 percentage points.
The collapse is most dramatic in Chips and Compute. Large-cap funds average 22.3%. IWP is at 3.65%. IWO is at 7.67%. The semiconductor and compute hardware story that has driven AI infrastructure investment is almost entirely a mega-cap phenomenon. US Small-cap growth companies in these index-based ETFs are not building the chips or the data centers. They are doing something else entirely.
IWP’s AI profile adds another layer to this. While its total AI alignment is far below large-cap peers, its Power and Energy AI sub-theme score is 19.68%—nearly five times the large-cap average of 4.1%. IWP is not absent from the AI story. It is accessing a different part of it: the energy infrastructure buildout required to power AI data centers rather than the compute hardware sitting inside them. As we documented in our prior piece, Power and Energy was the top-performing AI sub-theme over the past year, returning 264%. IWP’s exposure to that layer, however unintentional, is structurally significant.
The bottom line: a growth ETF label does not guarantee AI exposure, and AI exposure does not guarantee the right kind of AI exposure.
| AI Sub-Theme | Large-Cap Average | IWP (Mid-Cap) | IWO (Small-Cap) |
|---|---|---|---|
| AI Total | 64.0% | 38.25% | 26.52% |
| Chips & Compute | 22.3% | 3.65% | 7.67% |
| Cloud & Infra | 21.0% | 6.99% | 8.50% |
| Power & Energy | 4.1% | 19.68% | 3.69% |
| Apps & Services | 7.2% | 5.78% | 5.04% |
| Models & Data | 8.8% | 2.15% | 1.63% |
Large-Cap Average = VUG / IWF / IVW / SCHG / MGK / IWY. QQQM excluded (Nasdaq methodology outlier). Source: Noonum, June 2026.
Finding 3: Agricultural Tech Is Hiding in Plain Sight
Nothing in the name Nasdaq-100 suggests agricultural technology. Nothing about a fund tracking the Russell 2000 Growth index implies food innovation. Yet QQQM scores 15.24% on the Noonum Agricultural Tech and Food Innovation Megatrend, the highest score of any fund in this study. IWO follows at 14.00%. IWP is at 9.38%.
The six large-cap core funds sit between 1.95% and 4.15% on this same theme.
QQQM’s AgTech score is seven times SCHG’s, despite both funds targeting large-cap growth companies. Within QQQM’s AgTech allocation, the largest concentration is in Healthy Food and Supplements at 8.91%, with meaningful positions in Agri and Food Tech (1.84%) and Plant Based Meat Alternatives (4.49%). These are not rounding errors. They reflect genuine exposure to food innovation, precision agriculture, and biotech-adjacent food companies embedded in the Nasdaq-100 by virtue of their market cap and growth characteristics, not their industry classification.
This is a theme that almost never appears in fund marketing materials. It does not feature in the names, stated objectives, or factsheets of any fund in this study. Yet Noonum’s language scoring surfaces it consistently wherever it exists. Investors evaluating QQQM as a pure technology play are missing a material agricultural technology exposure that has been sitting in the portfolio the whole time.
| ETF | AgTech Total | Healthy Food & Supp. | Agri & Food Tech | Plant Based Meat |
|---|---|---|---|---|
| QQQM | 15.24% | 8.91% | 1.84% | 4.49% |
| IWO | 14.00% | 7.80% | 4.49% | 1.71% |
| IWP | 9.38% | 3.68% | 4.87% | 0.83% |
| IWF | 4.15% | 1.97% | 1.34% | 0.85% |
| IWY | 3.81% | 1.84% | 1.09% | 0.88% |
| VUG | 3.49% | 1.70% | 1.38% | 0.41% |
| IVW | 3.33% | 1.26% | 1.63% | 0.44% |
| MGK | 2.15% | 1.31% | 0.85% | 0.00% |
| SCHG | 1.95% | 1.01% | 0.94% | 0.00% |
AgTech sub-category scores as % of total portfolio alignment. Source: Noonum, June 2026.
Finding 4: Smaller-Cap Growth Is a Biotech Story, Not an AI Story
In large-cap growth funds, Biotech and Oncology represents 6% to 8% of total Transformative Technology exposure. It is a rounding error within a category dominated by AI and general technology companies.
In IWP, Biotech represents 28.95% of Transformative Technology exposure. In IWO, 23.82%.
This is not large-cap pharmaceutical exposure. The companies driving these scores are not Eli Lilly or AbbVie. This is pipeline-stage biotech: cancer innovation, genomics, MedTech, and clinical-stage pharma. The risk and return characteristics of these businesses are fundamentally different from the hyperscaler and semiconductor names driving large-cap growth fund performance. A binary drug approval event is not the same economic driver as an NVIDIA earnings beat.
Investors who hold IWP or IWO as growth fund complements to large-cap positions are carrying more biotech concentration than most fund labels communicate. Noonum’s language scoring makes that visible. Standard index methodology descriptions do not.
| ETF | Biotech % of TransTech | TransTech % of TransTech |
|---|---|---|
| IWP | 28.95% | 32.80% |
| IWO | 23.82% | 49.66% |
| SCHG | 8.27% | 28.81% |
| IWF | 8.05% | 29.01% |
| IWY | 7.87% | 28.38% |
| IVW | 6.77% | 28.68% |
| MGK | 6.38% | 28.69% |
| VUG | 6.08% | 28.89% |
| QQQM | 7.09% | 33.39% |
Biotech & Oncology as % of Transformative Technology sub-total. Source: Noonum, June 2026.
Finding 5: The GLP-1 Trade Is Concentrated in the Most Mainstream Funds
Within the Health and Wellness sub-theme, one category dominates in large-cap growth funds: GLP-1 and Weight Loss.
SCHG allocates 70.2% of its Health and Wellness exposure to GLP-1 companies. IWY is at 62.3%. IWF at 60.5%. IVW at 57.2%. These are not peripheral positions. The commercialized weight loss and metabolic health story has become the defining healthcare narrative inside mainstream large-cap growth funds.
QQQM is the notable exception at just 0.76%. The Nasdaq-100’s construction methodology excludes most large pharmaceutical companies by design, leaving its health exposure concentrated in healthcare technology and biotech rather than commercial drug franchises.
IWP and IWO are near zero. Their health exposure is concentrated in pipeline-stage Biotech, not approved and commercialized drugs. The distinction matters: pipeline biotech and commercial pharma respond to entirely different catalysts.
Three distinct healthcare profiles are running simultaneously across what is labeled as a single asset class. SCHG investors are expressing a view on commercial GLP-1 dominance whether they know it or not.
| ETF | GLP-1 % of H&W |
|---|---|
| SCHG | 70.2% |
| IWY | 62.3% |
| IWF | 60.5% |
| IVW | 57.2% |
| MGK | 56.2% |
| VUG | 47.8% |
| IWO | 5.61% |
| QQQM | 0.76% |
| IWP | 0.18% |
GLP-1 & Weight Loss as % of Health & Wellness sub-theme. Source: Noonum, June 2026.
Finding 6: Small-Cap Growth Faces a Different Kind of Political Risk
The Geopolitics and Economy Megatrend reveals a structural divide that rarely features in growth ETF analysis.
Within large-cap growth funds, between 46% and 55% of Geopolitics category exposure sits in Policies, Politics, and Economics: macro-driven themes including interest rate sensitivity, domestic regulation, and fiscal policy cycles. Raw geopolitical exposure, covering trade disruption, defense spending shifts, and global supply chain risk, accounts for 22% to 28%.
In IWP and IWO, this split inverts completely. Geopolitics reaches 60.12% and 63.05% of the category respectively. Policies, Politics, and Economics collapses to 17.61% and 7.93%.
The interpretation is structurally coherent. Large-cap companies with global revenue bases, established regulatory relationships, and diversified operations are more insulated from acute geopolitical events. Their political risk is primarily macro: what happens to rates, to trade policy frameworks, to fiscal deficits. Small-cap companies, operating with narrower customer bases and more concentrated supply chains, are more directly exposed to the raw edge of geopolitical disruption.
QQQM sits between the two poles. Its Geopolitics score of 40.06% is higher than any other large-cap fund, driven by semiconductor supply chain concentration and US-China technology trade exposure. The Nasdaq-100’s dependence on companies like NVIDIA, TSMC, and Broadcom creates a geopolitical sensitivity profile that differs meaningfully from the other large-cap funds in this study.
| Fund | Policies & Economics % | Geopolitics % | Fintech % |
|---|---|---|---|
| Large-Cap Avg | 50.1% | 24.9% | 26.6% |
| QQQM | 51.4% | 40.1% | 8.5% |
| IWP | 17.6% | 60.1% | 22.3% |
| IWO | 7.9% | 63.1% | 29.0% |
% of Geopolitics & the Economy Megatrend sub-total. Source: Noonum, June 2026.
What This Means
The growth ETF category has a transparency problem.
The six largest and most widely held large-cap growth funds are, through the Noonum Megatrends lens, functionally identical portfolios. The two smaller-cap funds in this study carry biotech concentration, agricultural technology exposure, and geopolitical risk profiles that differ fundamentally from their large-cap counterparts, but none of that is communicated in the fund names, stated objectives, or standard marketing materials.
For investors building growth allocations, three questions are worth asking about any fund you hold or are considering:
Which Megatrend is actually driving this fund? Transformative Technology and AI dominate large-cap growth funds at 18% to 24% portfolio alignment. But Agricultural Tech at 15% in QQQM, or Biotech at 29% of TransTech in IWP, represents a materially different growth thesis. The Megatrend profile tells you what economic forces the fund is actually leveraging.
How much of your growth allocation is genuinely differentiated? If you hold two or more of VUG, IWF, IVW, SCHG, MGK, or IWY, the Noonum data shows you are running nearly identical thematic bets. True diversification across growth requires moving across size tiers or into structurally different construction methodologies.
What is the actual healthcare story in your portfolio? SCHG investors are 70% weighted toward commercialized GLP-1 companies within their health exposure. QQQM investors are near-zero. IWP and IWO investors are in pipeline biotech. These are three fundamentally different healthcare bets operating under the same growth label.
The growth label covers an enormous amount of ground. Noonum’s language-based scoring makes the actual terrain visible.
About Noonum
Noonum is an AI agent that builds language-based analytics to measure how aligned any company or portfolio is to a given investment objective. Rather than relying on sector classifications or price data, Noonum quantifies the actual language companies use in filings, transcripts, press releases, and news to score exposures to any given investment objective, construct indices and optimized portfolios, and let investors compare their portfolios against any investment lens they choose. noonum.ai
This report is published by Noonum for informational and research purposes only. It does not constitute investment advice, a recommendation to buy or sell any security, or an offer of any kind. Past performance is not indicative of future results. Holdings data as of June 2026. Noonum Linguistic Beta scores reflect portfolio-weighted thematic alignment derived from company filings, earnings transcripts, and press releases. Copyright 2026 Noonum. All rights reserved. noonum.ai